Prof Douglas J. Paul > Silicon Germanium (SiGe) Bandstructure
The first main paper to calculate the band alignments of Si/SiGe heterostructures was by Chris Van der Walle in 1986 (Phys. Rev. B 34, 5621) and since then there have been an enormous number of papers on the band structure and band alignments of the Si/SiGe system. There was a significant arguement in the 1990s about the band alignment inferred from photoluminescence data which was finally resolved in 1998. The reader is therefore warned that there are many papers in the literature with the incorrect band alignments and band structure. There are two papers which should be used with the correct band structure, and alignments along with excellent reviews of the strain parameters although the theoretical values of bandgap and discontinuities are sometime different from the exact experimental values but are qualitatively correct:
Martin M Rieger and Peter Vogl, Phys. Rev. B 48, 14276 (correction PRB 50, 8138 (1994))
Max V Fischetti and Steven E Laux, J. Appl. Phys. 80, 2234 (1996)

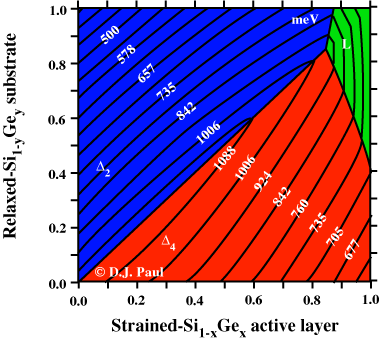
On the left hand side is a plot of the bandgap from the Rieger and Vogl paper but with the values scaled to the experimentally determined values. The left axis is the Ge content of a virtual substrate while the bottom axis is the Ge content of the active heterolayer. All values are in meV and the band structure swaps from Si-like to Ge-like in the green section of the top right. The blue is tensile strain and the red is compressive strain.

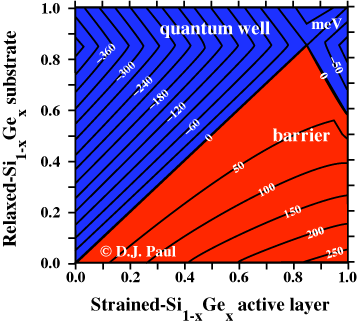
The figure on the right hand side is of the conduction band discontinuity between a relaxed virtual substrate Ge content on the left axis compared to an active heterolayer on the bottom axis. Negative values in blue correspond to quantum wells and positive values in red correspond to quantum mechanical tunnel barriers to electron transport. The values are again corrected to experimentally determined values.

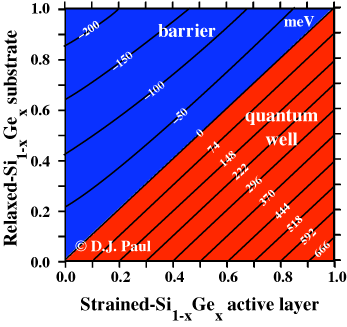
The figure on the left hand side is of the valence band discontinuity between a relaxed virtual substrate Ge content on the left axis compared to an active heterolayer on the bottom axis. Negative values in blue correspond to quantum mechanical tunnel barriers and positive values in red correspond to quantum wells.
